

Anatomy of a trading cockpit: one screen, eight widgets, and what feeds each one
A reference desk taken apart tile by tile — what each widget is, which connection feeds it, which wires bind them together, and what keeps running once the tab is closed. Less a release note than a map.
Most of what we write here is a release note: something shipped, here is what it does. This is a different kind of post. Nothing below is new. It is one finished screen, taken apart, so you can see how the pieces we ship separately actually sit together.
The desk is a crypto cockpit — eight widgets on one screen, built from public market data, no keys anywhere. Nothing about it is special. That is the point: every part is something you can rebuild by describing it.
The screen
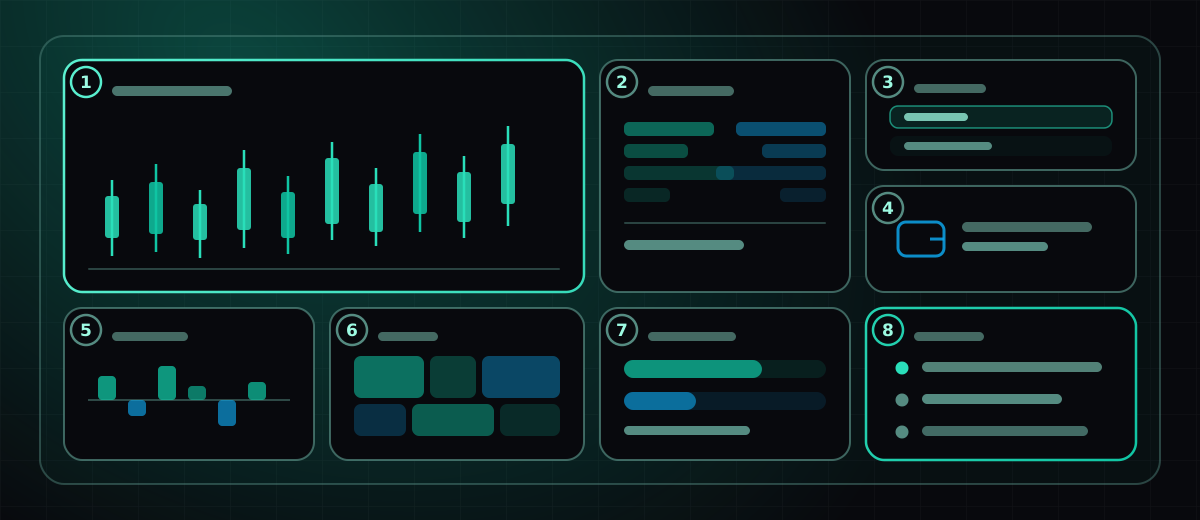
- Candlesticks. The anchor tile. One symbol, one interval, a live last candle. Everything else on the screen either feeds it or follows it.
- Order-book depth. Bids and asks as stacked bars, so a thin book is visible rather than inferred.
- Watchlist. A handful of symbols, one of them selected. This tile is the screen’s steering wheel — more on that below.
- Wallet balances. A public address, read-only, through a wallet connection. No signing, no keys, nothing to approve.
- Funding rates. Perp funding across the last few windows, positive and negative on either side of a zero line.
- Heatmap. The same universe as the watchlist, sized and shaded, for glancing rather than reading.
- Prediction markets. What a crowd is pricing, next to what the order book is pricing. The two disagreeing is the interesting part.
- Alert inbox. Empty most of the day. Filled by a bot that keeps working with the tab closed.
A screen is one arrangement of widgets. A workspace holds several of them. The canvas is free-form — you place things where you want them, and groups can stack tiles into mosaics or tabs — but it is a canvas with edges, not an infinite plane you get lost in.
Follow one tile all the way down
Every tile on that screen has the same four layers underneath it. Take the watchlist:
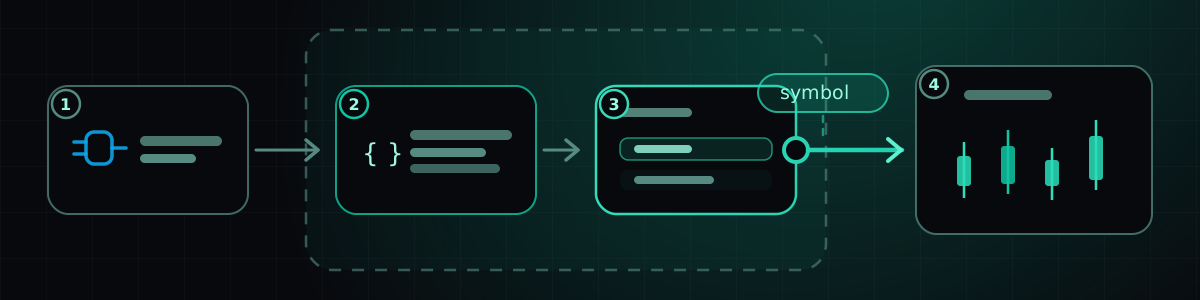
- A connection. One of the 90 live connectors — here, public market data, which needs no credentials at all. Connections are inventory, not configuration: you attach one to a widget and the widget is rebuilt knowing how to use it.
- Generated code. You described a watchlist; a build wrote one. It has a version history, and you can read every turn of the conversation that produced it.
- The running widget. It executes sandboxed. A widget that misbehaves ruins its own tile and nothing else on the screen — which is the only reason it is reasonable to run software you didn’t read.
- A wire out. The tile emits when you click a row. On its own that goes nowhere. What makes it a cockpit rather than eight separate tiles is the next part.
What holds it together is wiring, not code
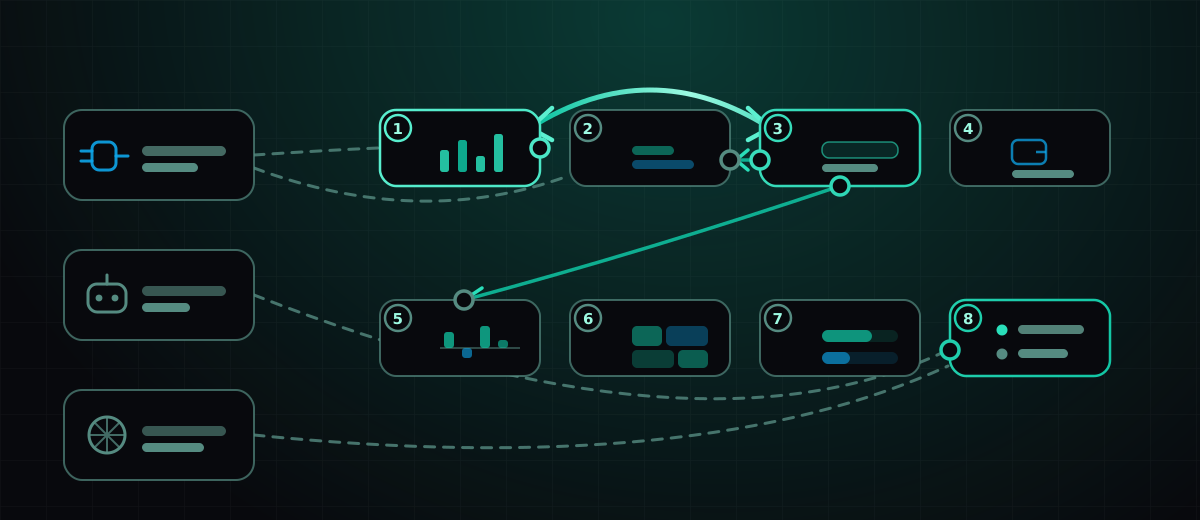
Two mechanisms sit behind the single word wire, and the distinction shows up in the diagram as solid versus dashed:
- Widget to widget is a glue link — real generated code, with its own version history, running in its own hidden runtime, mapping what one tile emits into what the other expects. The arc between the watchlist and the chart is two-way: change the symbol in either and both follow. Two-way wires would echo forever without help, so a delivered value is remembered and the identical bounce-back is dropped once.
- Widget to a connection, bot or agent is an attachment — a record of what a rebuild taught that widget’s own code to do. Those are the dashed lines. Staged rather than automatic, so browsing five sources in a row costs one rebuild instead of five.
On this screen the wiring is deliberately thin: the watchlist drives the chart both ways, and drives the order book and the funding tile one way. Three wires. Adding a fourth for the heatmap was tempting and wrong — a tile that changes when you weren’t looking at it is a tile you stop trusting.
The wire editor has a Test it bar for exactly this. Pick a topic and a value, choose which end is pretending to emit, and send a real event through the real runtime. The verdict distinguishes this wire isn’t running from it ran but forwarded nothing for that topic from forwarded, but that widget isn’t on screen to receive it. Before that existed, a broken wire and a wire pointing at another screen looked identical: nothing happened.
What keeps running when the tab is closed
Tile 8 is the only one that isn’t really a widget in the usual sense. It is an inbox, and what fills it is a bot.
Bots are deliberately unglamorous — a fixed catalogue of processors (threshold, change, crossover, RSI, volume spike, digest, new trade, wallet activity, wallet balance) over exactly three kinds of thing: market candles, a broker account, a public wallet address. There is no model in the loop, which is precisely why you can leave one running for a month. When one fires it fans out to four places at once: the alert inbox, the widget bus (so tile 8 updates live), a webhook, and a connected database.
Agents are the other half, and the opposite shape: general-purpose, with per-tool grants for web search, social, market data, databases, memory and more, on a manual or 15-minute-to-daily trigger. An agent is what you reach for when the question is “summarise what happened overnight” rather than “tell me when this crosses that.” Both feed tile 8; only one of them is cheap to leave unattended.
What this screen deliberately doesn’t do
It doesn’t trade. Nothing here places an order — that is a separate grant, on a separate connector, and putting it on the same screen as a heatmap you glance at is how accidents happen.
It doesn’t hold a key. Every source is public: candles, depth, funding, prediction markets, a read-only address. A desk you can hand to someone else without revoking anything afterwards is worth more than a desk with two extra tiles.
And it isn’t finished, because that isn’t a state a screen reaches. The honest version of this teardown is that the layout above is the fourth one; the first three had more tiles and told you less.
Launch Nexow and describe the first tile. The other seven are easier.
Build your first widget in the next minute
Open the preview, describe one useful thing, and place it on your canvas.